Grafana is an open-source analytics and monitoring platform that lets you query, visualise, and alert on metrics. It pairs well with Prometheus for scraping application endpoints. This post walks through a Docker Compose stack that monitors a simple .NET API.
Setting up Grafana
To visualise metrics data, we need a few components. The .NET application exposes a /metrics endpoint. Prometheus scrapes it on an interval and stores the samples. Grafana then queries Prometheus and renders dashboards.
Docker Compose File
Start with a Compose file for Prometheus and Grafana. Pin image tags so rebuilds stay reproducible (bump them when you deliberately upgrade):
services:
  prometheus:
    image: prom/prometheus:v3.4.0
    ports:
    - 5431:9090
    volumes:
      - ./prometheus/:/etc/prometheus/
      - prometheus:/prometheus

  grafana:
    image: grafana/grafana:11.6.0
    expose:
      - "3000"
    ports:
      - 3000:3000
    volumes:
      - grafana:/var/lib/grafana

volumes:
  prometheus:
  grafana:
This brings up Grafana and Prometheus, maps ports, and mounts config/data volumes.
Prometheus Configuration
Next, create a prometheus.yml file to configure Prometheus:
global:
  scrape_interval:     15s
  evaluation_interval: 15s

scrape_configs:
  - job_name: 'api'
    scheme: 'https'
    tls_config:
      insecure_skip_verify: true
    scrape_interval: 10s
    scrape_timeout: 5s
    static_configs:
    - targets: ['api.example.com:443']
This configures how often the /metrics endpoint should be scraped. By default Prometheus expects something like http://api.example.com/metrics. Because my API ran under HTTPS I set scheme to https and skipped TLS verification in this lab setup. scrape_interval is how often the endpoint is scraped; if scrape_timeout is omitted the global value is used.
More information about configuring Prometheus can be found here .
Grafana Config
You can now log into Grafana on http://localhost:3000
with the default username and password of admin/admin. You will be prompted to change the password. Add a Prometheus data source next. Prometheus is published on the host as http://localhost:5431
, but from another container you usually cannot use localhost for a sibling service.
If Grafana needs to reach Prometheus on the host (for example when Prometheus is published only to the host network), use host.docker.internal (Docker Desktop and many Linux setups with the host-gateway mapping): http://host.docker.internal:5431
. Prefer the Compose service name (http://prometheus:9090) when both services share the same Compose network.
Dashboard
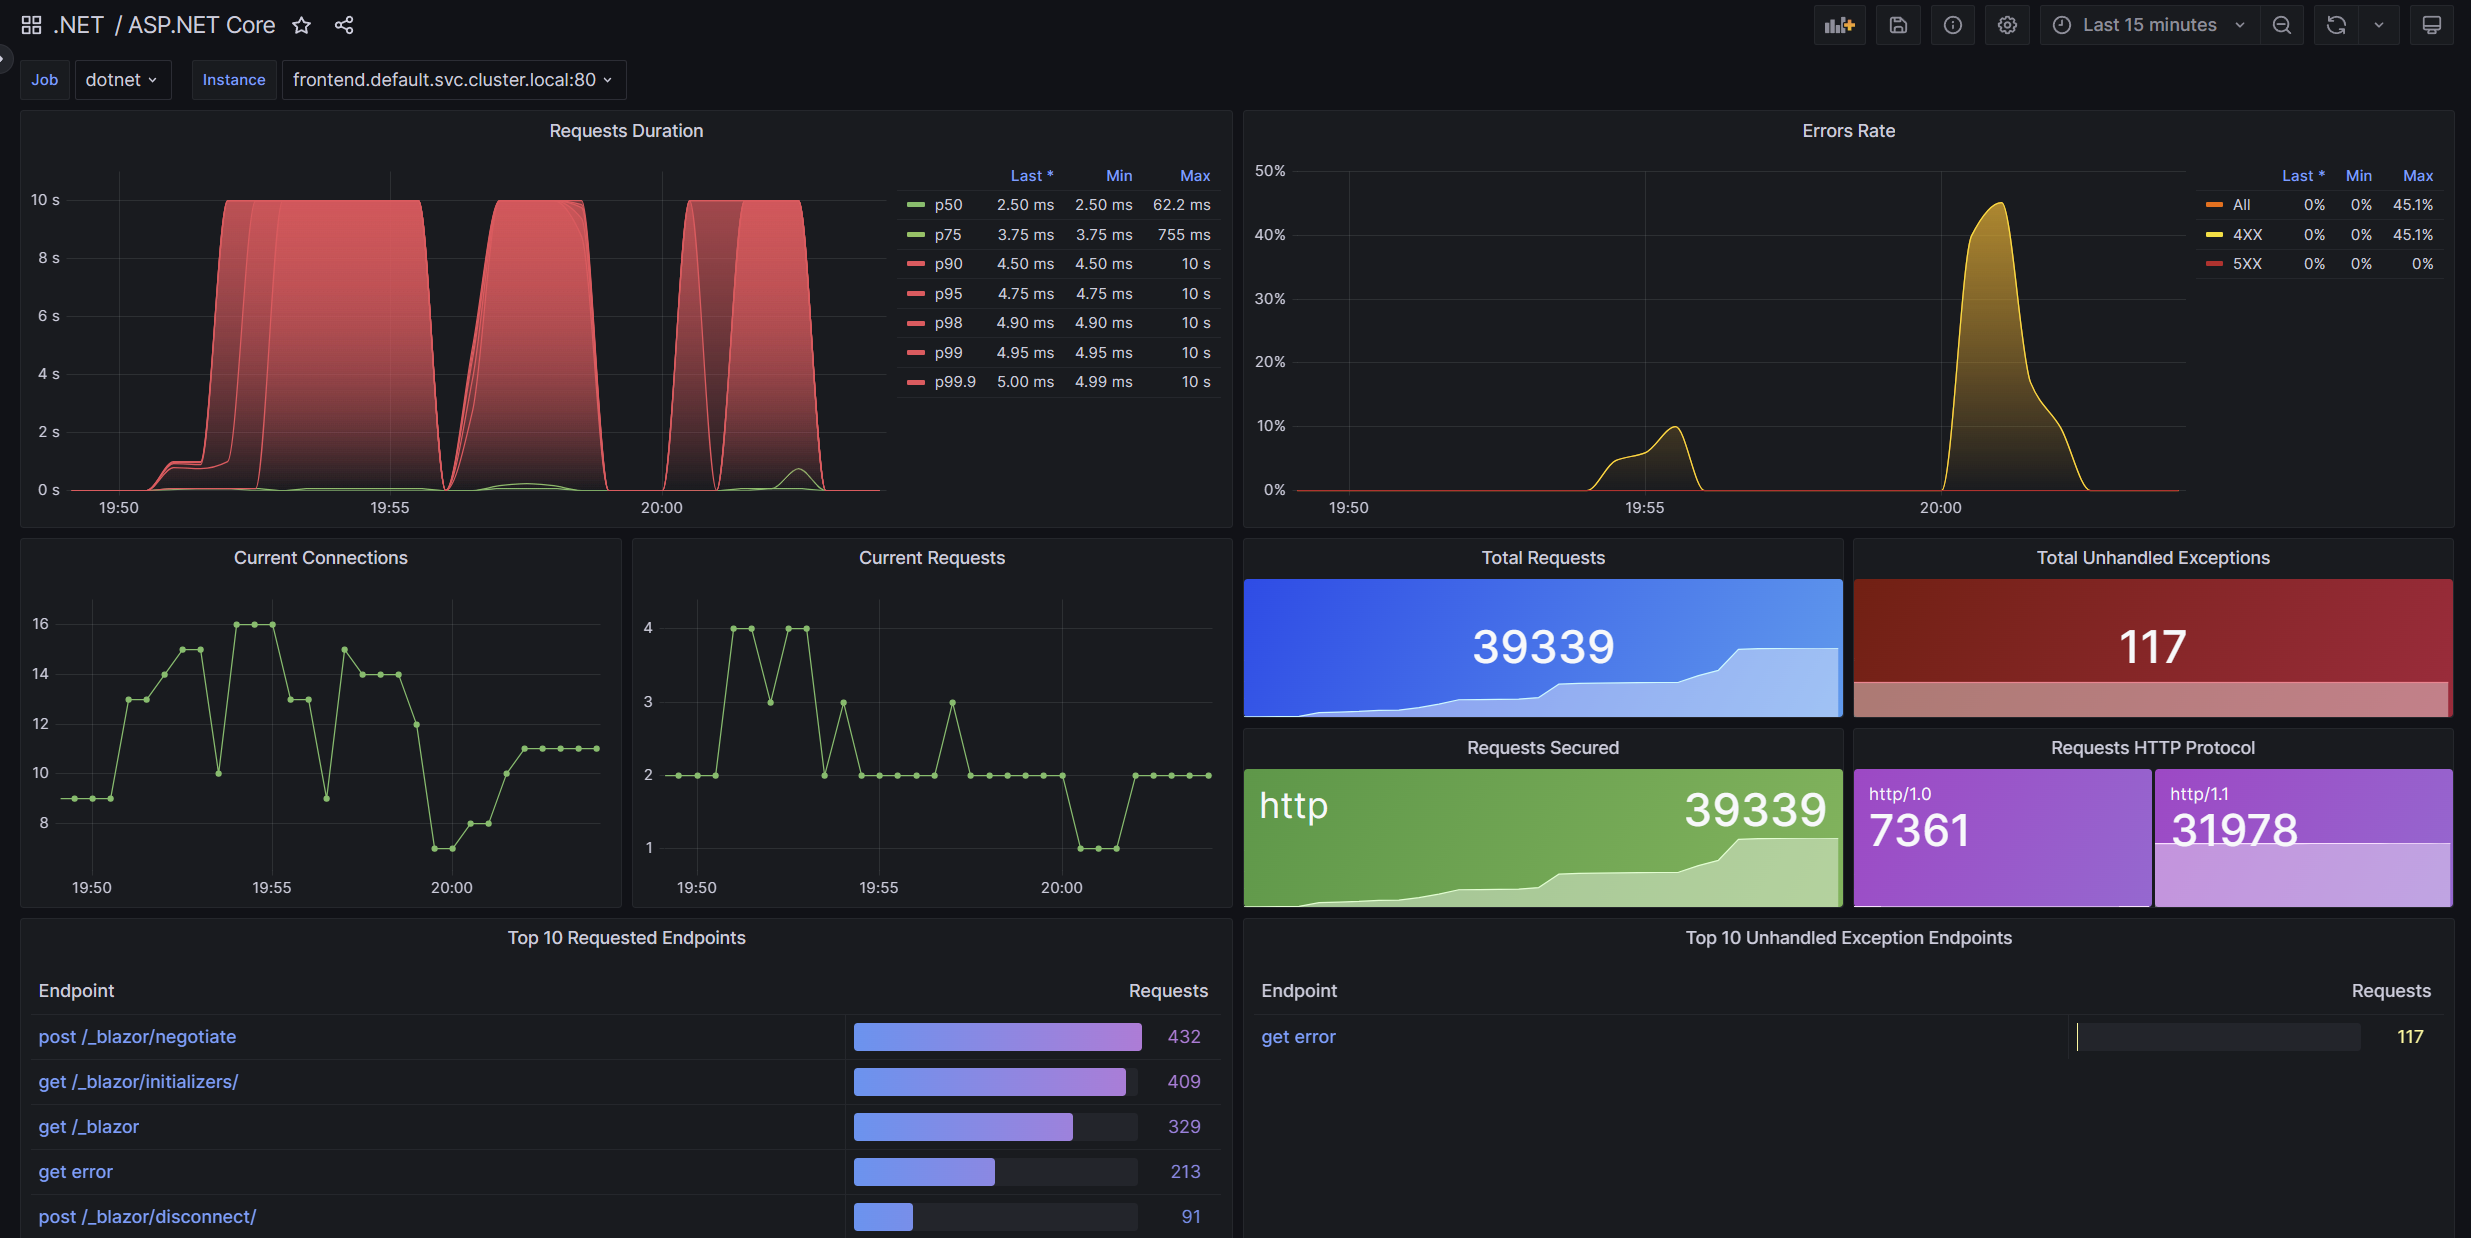
The next thing we need to do is build a dashboard — the .NET team has done much of the hard work. They published a Grafana dashboard you can import.
You can also build panels yourself in the Grafana UI (graphs, gauges, and other visualisations).
Metrics endpoint
If your .NET application is using .NET Aspire, this /metrics endpoint is often already set up for you. Look in Extensions.cs in your ServiceDefaults project for something like the following (you need the NuGet package OpenTelemetry.Exporter.Prometheus.AspNetCore):
public static WebApplication MapDefaultEndpoints(this WebApplication app)
{
  // The following line enables the Prometheus endpoint (requires the OpenTelemetry.Exporter.Prometheus.AspNetCore package)
  app.MapPrometheusScrapingEndpoint();
}
If you are not using .NET Aspire, you can add app.MapPrometheusScrapingEndpoint() to your Program.cs file (with the same package referenced).
Conclusion
With Compose, Prometheus, and Grafana in place you can scrape a .NET /metrics endpoint and watch live dashboards — useful for latency, exceptions, and ASP.NET Core built-in meters. Happy monitoring!
Related on this blog
Prefer classic host and service checks? Try monitoring with Nagios in Docker . If Aspire already wires OpenTelemetry for you, getting started with Aspire is a useful companion to the metrics endpoint notes above.
If you have enjoyed this article and want to get a monthly email with all my latest articles, please sign up to my newsletter . If you have any questions or comments, please feel free to reach out or leave a comment below.
Comments